
HPC DATA SYMPHONIES by Dr. Kirell Benzi
In the framework of S+T+ARTS EC(H)O – Challenge 7: Transforming Logs Into Visual Narratives
The project
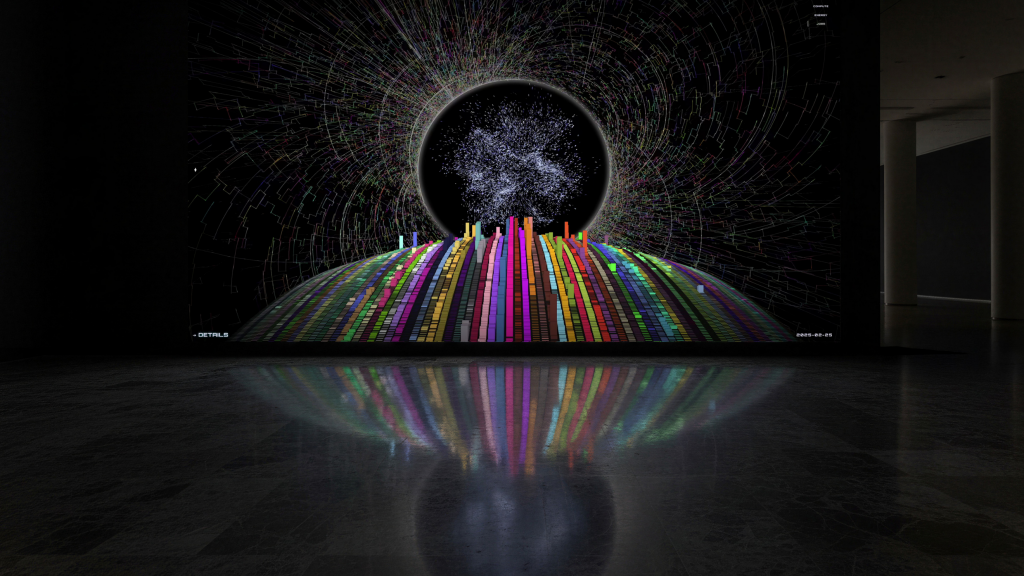
Dr. Kirell Benzi is developing HPC DATA SYMPHONIES, a public-facing installation designed to make the invisible inner workings of the HLRS high-performance computing (HPC) center visible and understandable to non-specialist audiences. The artwork transforms live log data from HLRS’s HAWK supercomputer into an evolving digital landscape, visualized as a heightfield where extruded cubes correspond to compute activity by scientific field (e.g., climate modeling, AI, materials science). The project’s goal is to move beyond conventional visualization by developing a composite visual language where visual parameters (like height, shape, texture, color, and rhythm) are directly tied to real metrics such as compute time and energy consumption, ensuring the resulting landscape is expressive and data-driven.
Hosted by: HLRS + Media Solution Center
The artist
Dr. Kirell Benzi is an award-winning data artist and AI researcher whose work explores how information can be transformed into artistic and immersive experiences. Holding a Ph.D. in Data Science from the École Polytechnique Fédérale de Lausanne (EPFL), he investigates the intersection of art, artificial intelligence, and visualization to reveal the hidden structures shaping our world.
His practice treats data as a living material: something that can be sculpted, animated, and experienced. Through large-scale installations, artistic data visualizations, and interactive environments, Benzi transforms complex datasets into narratives that engage both intellect and emotion.
Bridging scientific inquiry and artistic expression, his work proposes a new language for perceiving the systems that define contemporary life. He has collaborated with museums, research institutions, and corporate partners worldwide, and his data art has been presented at international exhibitions and conferences, earning recognition for its distinctive approach to visualizing complexity.